What the Index reveals about the SA economy’s recent performance
The value of South Australia’s top 100 companies has grown significantly in the past four years with a number of industry bright spots and one particularly obvious warning signal, according to an analysis of the South Australian Business Index since 2016.

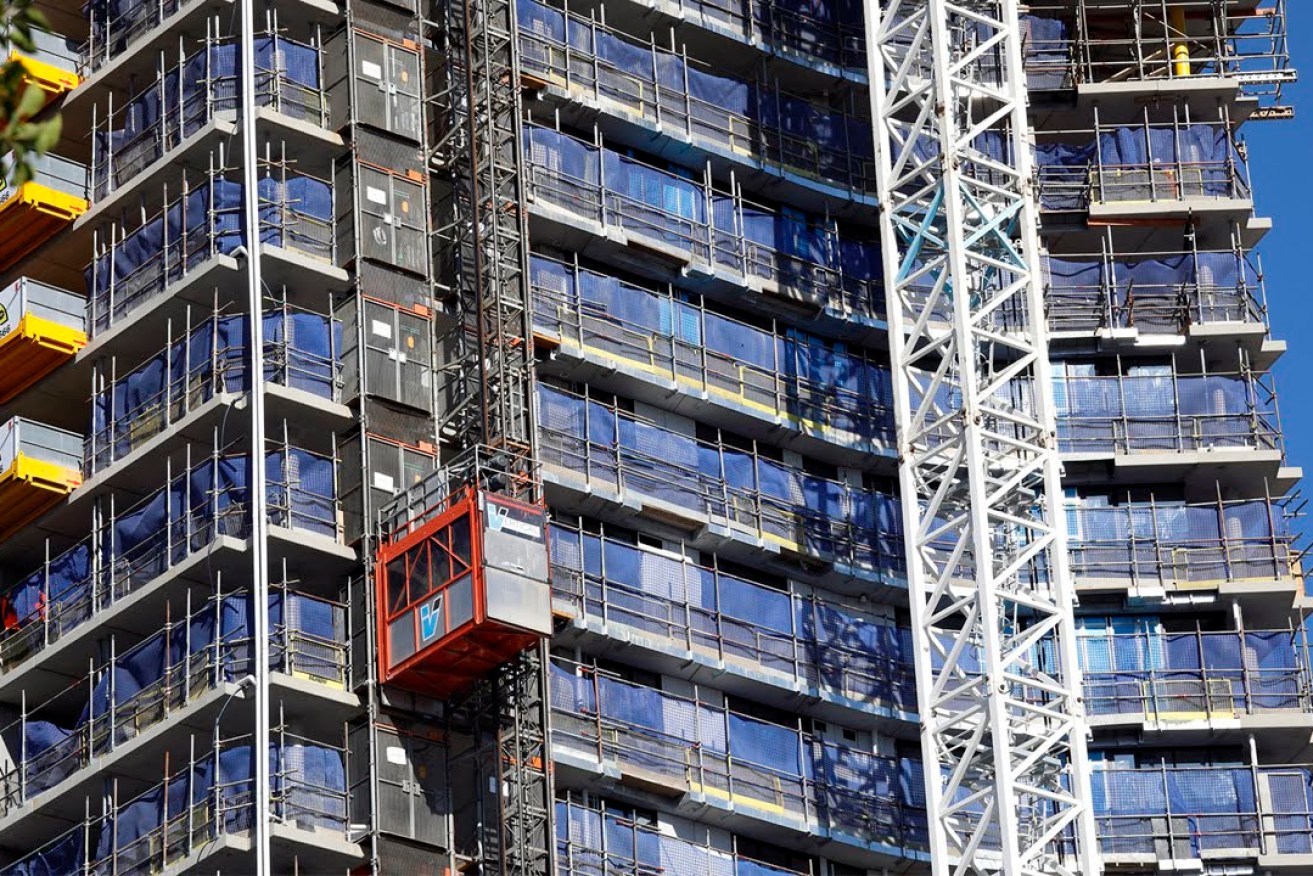
Building and construction has come off the boil in the past four years. Photo: Tony Lewis/InDaily
The Index, an independent ranking of the state’s top 100 businesses, began in 2015, with financial services firm Taylor Collison taking over the analysis in 2016.
To celebrate the fifth anniversary of the Index, Taylor Collison has produced an analysis of the data since 2016 (the methodology changed from 2015, so a direct comparison with that year isn’t useful).
What it shows is an overall positive picture of growth for Adelaide’s big end of town, but with some warning signs developing over the past year or so.
The total market capitalisation of the companies in the Index has increased from $36 billion in 2016 to $54 billion this year, with the biggest jump between 2017 and 2018.
When the Index began in 2015, the energy sector was in a slump.
Given the dominance of Santos in the South Australian corporate sector, the recovery in oil and gas since then has seen the overall performance of the Index climb rapidly.
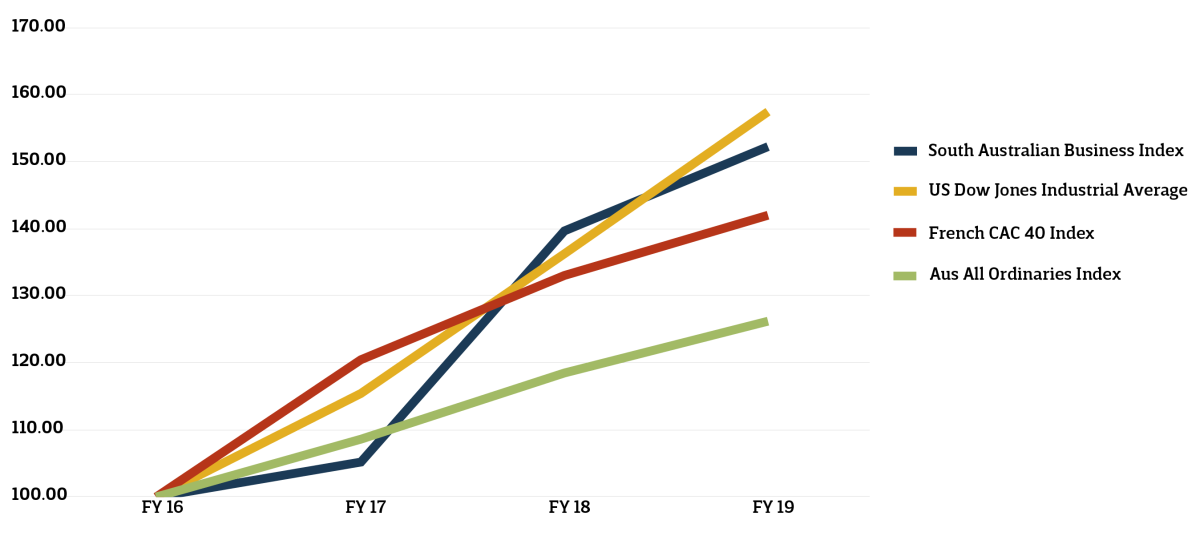
In fact, at the end of the 2017 financial year, in terms of growth, the Index was outperforming the US Dow Jones Industrial Average, the French CAC 40 Index and the Australian All Ordinaries.
While the indices are not entirely comparable, this analysis – by Taylor Collison – does give a broad indication of how the top end of town has fared.

Oil and gas has been the standout growth sector over this period.
Santos, the number one company on the Index since the beginning, has lifted its share price substantially, raised equity and cut costs. In the next tier, the market capitalisation of Beach Energy has increased from $1.1 billion to $5.6 billion.
The key drivers have been the recovery in the oil price, a decline in the Australian dollar compared to the US currency, and cost reductions across the industry.
On the downside is the falling performance of the building and construction sector.

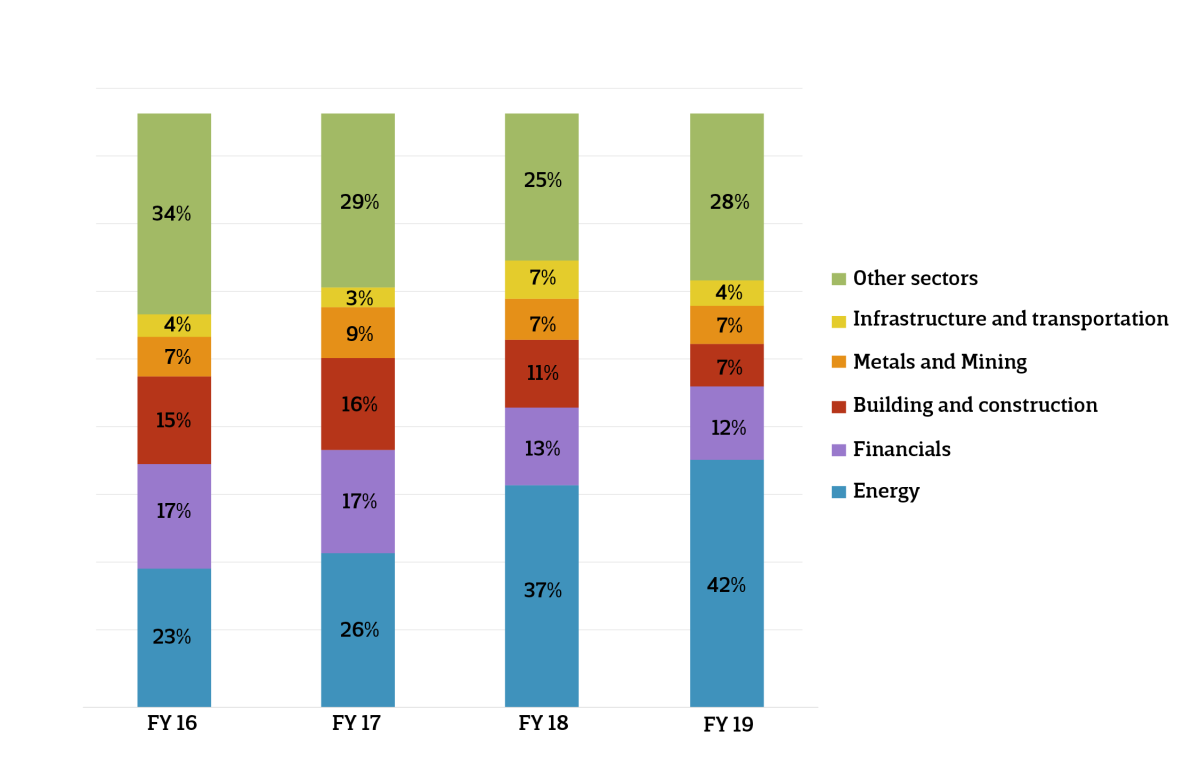
The industry composition of the Index over time, by market capitalisation.
The above chart shows that, in 2016, the energy sector represented under a quarter of the value of the total Index. This year it has hit 42 per cent, thanks to the recovery mentioned above.
By contrast, building and construction has declined markedly in its contribution to the Index, putting a brake on the overall growth picture over the past two years.
In 2016, building and construction was booming with companies like Adelaide Brighton on a high, but the housing downturn and, arguably, the impact of the royal commission into the financial industry, has seen the sector come off the boil.
The financial sector has been steady, with a 9 per cent increase in value over the past four years. Argo has performed well in line with equity markets, but the banking sector has been flat due to margin pressure as a result of low interest rates.
While mining has declined as a proportion of the Index composition, it has been a steady sector. In dollar terms, mining is up close to 50 per cent over the past four years.
Infrastructure has also increased as a proportion of the Index, with the likes of Flinders Ports experiencing significant revenue uplift.


